.svg.png)

How to Create a High Impact Sales KPI Dashboard

Managing and analyzing sales processes plays a critical role in businesses achieving their growth goals. In order to successfully manage these processes, it is necessary to effectively monitor, analyze sales performance and make strategic decisions. At this point, the sales KPI (Key Performance Indicator) boards come into play. A high-impact sales KPI dashboard helps businesses measure and improve their performance.
So, how to create a high-impact sales KPI board? In this article, we have provided you with a detailed roadmap on how to create a high-impact sales KPI board.

What is KPI?
KPIs are performance indicators that measure and evaluate how successful businesses are in achieving the goals they set. KPIs for the sales department track and analyze success with specific metrics in the process of achieving sales goals. For example, KPI for a sales team can be metrics such as the number of sales made in a given time period, customer satisfaction rate, or revenue generated.
KPIs not only analyze current performance, but also serve as a guide for shaping future strategies. A successful KPI must be clear and measurable, but also aligned with business objectives. High-impact KPIs, especially in the sales department, help you see the critical points of the business and areas of development.
How to Create a High Impact Sales KPI Dashboard

Creating an effective sales KPI dashboard requires a strategic approach. Each of the following steps explains in detail how this process can be carried out successfully.
1. Set Your Goals
The first step is to set clear and specific goals that form the basis of the KPI dashboard. Having clear goals allows KPIs to best serve your business. When setting goals, it is important to check if they meet SMART (Specific, Measurable, Achievable, Relevant, Time-bound) criteria.
Example:
- Customized Target: “Increasing the rate of new customer acquisition by 20% at the end of the first quarter.”
- Unclear Target: “We need to increase our sales.”
The first example clearly describes the goal, while the second example presents a very general and immeasurable goal. Setting such customized goals is essential for your KPI dashboard to be driven by accurate data.

2. Choose the Right KPIs
Different KPIs should be selected according to the needs of each business. Critical in this step is to identify KPIs that align with your business's strategic goals. For example, in a company that relies on customer relationships, the customer satisfaction rate can be a key performance indicator, while in a product-oriented firm, stock turnover can be important.
Example KPIs:
- Customer Acquisition Cost (CAC): All expenses incurred to acquire a client divided by the number of customers. This metric measures the cost-effectiveness of your marketing strategies.
- Conversion Rate: The rate that shows how many potential customers have converted to sales. Monitoring the conversion rate is an important indicator for increasing the effectiveness of the sales team.
- Average Sales Time: It measures the time from the first contact with a customer to the closing of the sale. This KPI can help you identify bottlenecks in the sales process.
3. Identify Data Sources

KPIs must be built on accurate data. The quality of the data is critical to the effectiveness of your board. Sources of data collection can be CRM software, sales reports, web analytics, and customer feedback. In this step, it is necessary to identify your data sources and update them regularly.
Example:
- CRM Software: Using CRM data, you can track the performance of sales representatives and customer interactions. In this way, KPIs such as cost of customer acquisition, sales time can be tracked instantly.
- Web Analytics: Tools like Google Analytics analyze digital marketing performance by measuring metrics such as conversion rate, time spent on the site.
4. Visualize the Dashboard
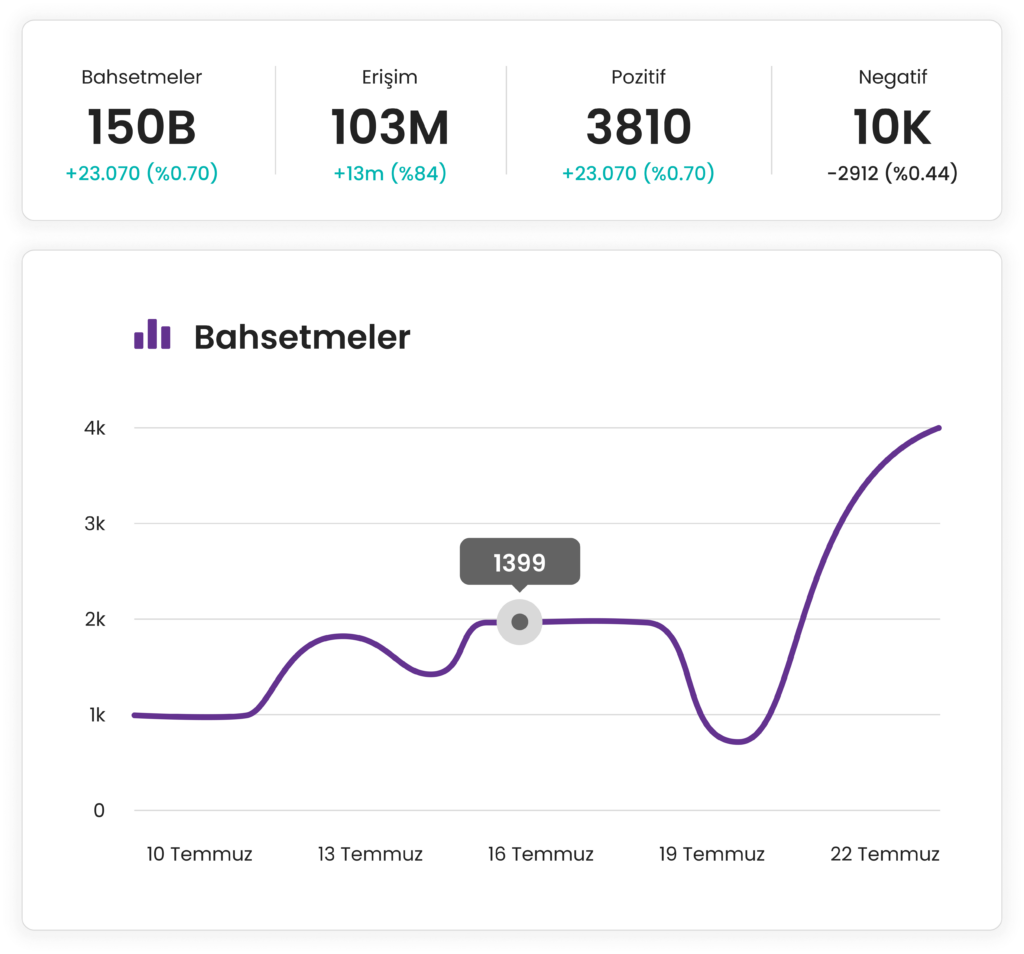
The clear and effective presentation of KPIs depends on the visualization of the data. Visual elements such as charts, bar charts, pie slices, or tables allow easy understanding of data for the sales team and managers. You can also observe trends in the performance of specific KPIs through visualization.
Example:
- Color Coding: When visualizing your KPIs, you can encode high performance in green and low performance in red. This helps the team to immediately recognize in which areas it needs improvement.
- Time Based Trends: Showing monthly sales figures on a chart can help you identify seasonal trends or sales fluctuations.

5. Monitor and Improve KPIs Regularly
Creating a sales KPI board is not a once-in-a-lifetime task. Sales performance needs to be constantly monitored and KPIs revised as needed. As the dynamics of your business change, your KPIs need to adapt to these changes.
Example:
- If a KPI initially meets the objectives but performance declines over time, this metric should be examined more closely and new strategies developed if necessary.
- Regular review of KPIs creates the opportunity to set new goals and strategies in cases where goals are not achieved.
6. Customize KPIs
Since each business has different needs and goals, KPIs should be customized. Your sales team's goals may vary by industry, customer base, and marketing strategies. This is why it is a great advantage that KPI boards are completely tailored to your business.
Example:
- If you sell your products through the retail sector, KPIs such as “average cart amount” and “revenue per customer” will make more sense to you. These KPIs can be customized according to the customer segment.
- In the service sector, KPIs such as “customer complaint rate” or “first call resolution rate” can be more effective.
Grispi's KPI Features and Advantages
Grispi CRM software provides a comprehensive set of tools for businesses to effectively manage their sales KPIs. With Grispi, you can easily create KPI boards and monitor sales performance instantly. The software provides accurate and reliable data with integrated data sources. This allows you to see and analyze the performance of your KPIs clearly.
Grispi's customizable KPI dashboards allow you to choose the metrics that best fit your business. At the same time, thanks to data visualization, you can instantly monitor the performance of your sales team, identify missing areas and take strategic steps. This flexibility helps your business make the right decisions on the path to success.
Grispi Prices
- Start-up: $7
- Level Up: $14
- Enterprise: $39
A high-impact sales KPI dashboard allows you to optimize the performance of your business and make sales processes more efficient. By setting your goals and choosing the right KPIs, and leveraging powerful CRM software like Grispi, you can contribute to the growth of your business. Regular monitoring and updating of the KPI dashboard will increase your business success in the long run.
Contact Us
Fill in the form for detailed information and demo account and we will call you.
Müşteri deneyimi için çözümler
Çok kanallı destek, satış otomasyonu ve yapay zeka gücünü tek bir platformda birleştirin. Operasyonel verimliliği artırarak müşteri sadakatini güçlendirin ve ölçülebilir sonuçları hemen görmeye başlayın!