.svg.png)


Data-driven

KPI Tracking
.svg)
Continuous Improvement
Continuously improve your customer experience through data-driven decisions.
Grispi automatically captures and reports key metrics across your end-to-end customer service. With a powerful reporting infrastructure, closely monitor your key performance indicators (KPIs), visualize the customer journey, and initiate a cycle of continuous improvement by making data-driven decisions.
Design interactive and customized reports on metrics such as Communication Resolution Rate, Customer Satisfaction Score (CSAT), Channel Performance, and Agent Analytics. Gain 360-degree customer journey insights to identify bottlenecks and guide your strategic planning.

Industry leaders transform customer experience with Grispi


Optimize your work and experience
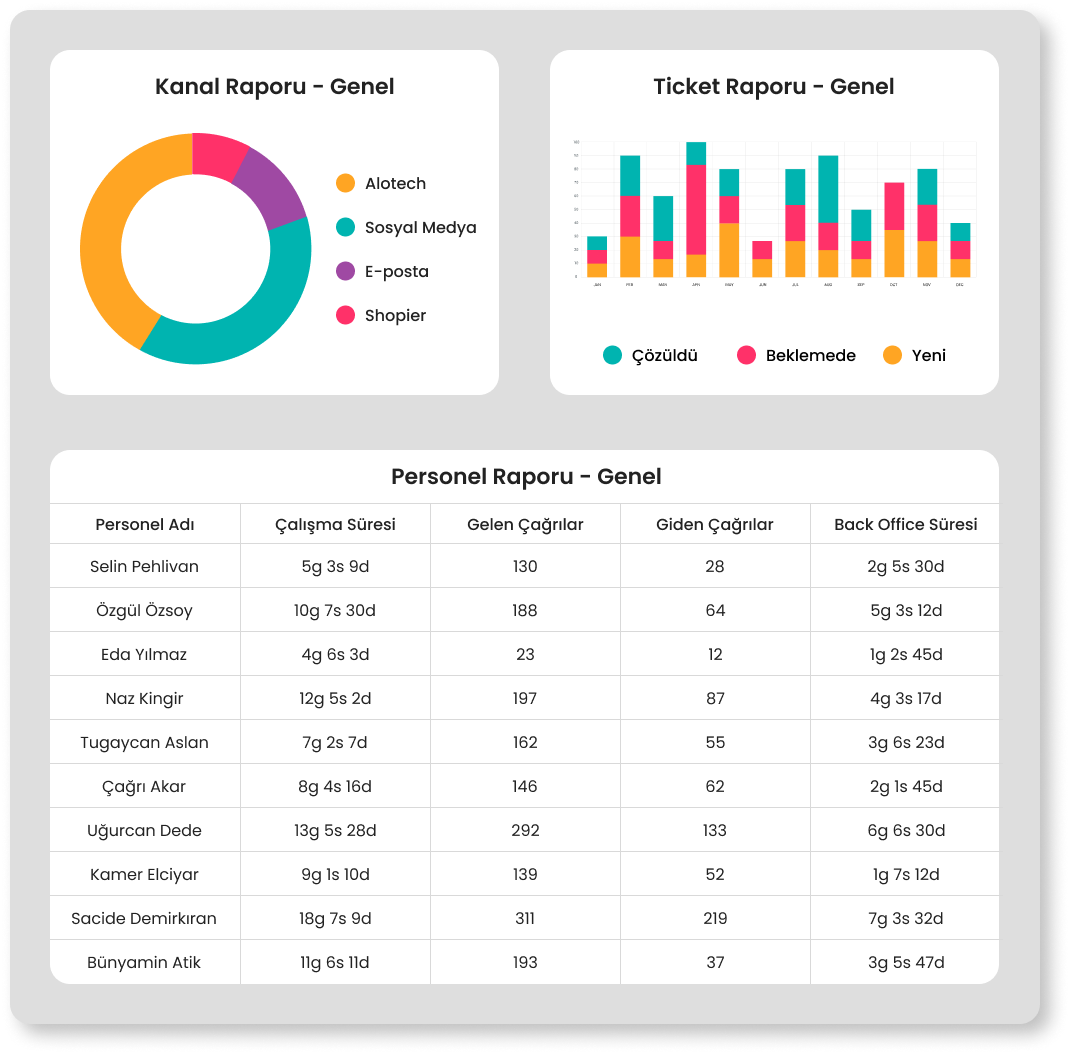
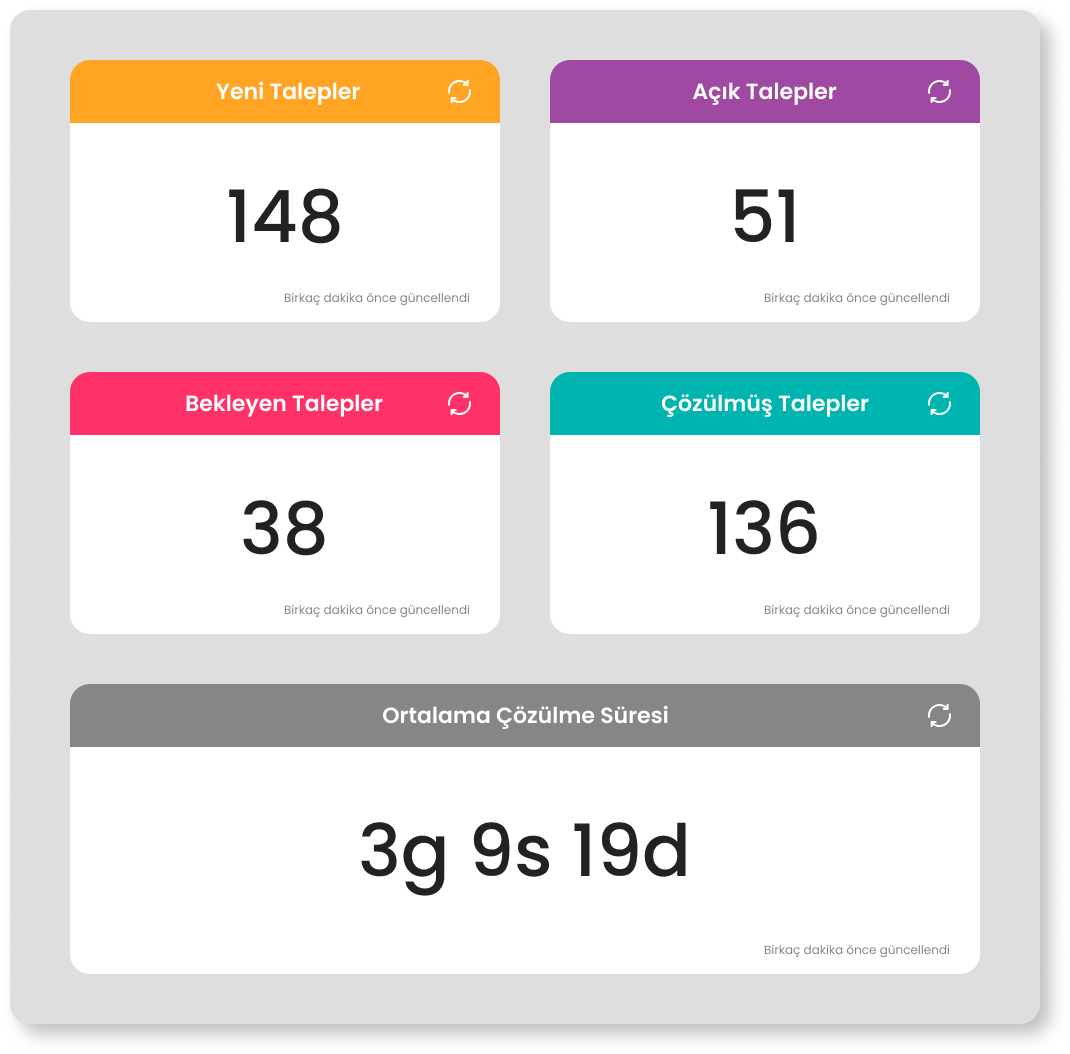
Key Metrics and KPIs
Monitor customer experience through initial contact, customer satisfaction, net supporter score, and other key metrics. Define your customer goals and identify areas for improvement.
Customer Journey Analysis
Visualize customer journeys across channels. Identify key factors influencing the customer experience and improve processes to eliminate problems.
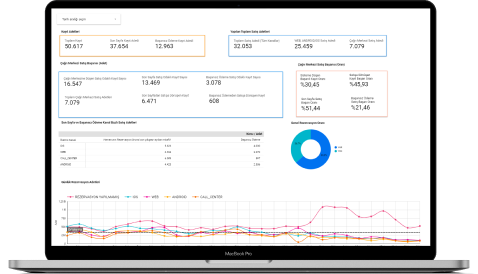
Historical Dashboards with Looker Studio
Monitor customizable, real-time and historical dashboards through Looker Studio. Visualize and filter interactive data.
Choose the most suitable plan Get started
 5 User Limit
- Live Chat
- 5GB Total File Size
- 10 API Requests per Minute
- 2 Number of Forms
$24/monthly
 Limitless
- Social Media Integration
- Ability to Batch Transactions
- 100 API Requests per Minute
- 3 Number of Forms
$54/monthly
- Limitless
- Social Media Integration
- Ability to Batch Transactions
- 500 API Requests per Minute
- 5 Number of Forms
Do you have any questions? We have the answers
Solutions for customer experience
Combine multi-channel support, sales automation, and the power of AI in a single platform. Increase operational efficiency, strengthen customer loyalty, and start seeing measurable results immediately!